Tag: statistics

Why Hasn’t the Stat Revolution Come to Hockey Yet?

No Comments

Funny SignIs it just me, or does it seem like sports trend of using and studying more statistics (especially newly tracked numbers) to improve your team not really affecting hockey all that much. ??? ????? ?? ???????? ????? There’s been a trend toward Finnish goaltenders who are great at not giving up rebounds and forcing the puck to the corner, but I don’t think that was due to any study of the actual numbers, just people realizing that the goaltenders coming from Finland are awesome.

Something else I’ve never understood is the whole dump and chase style of play. It just looks like a way of giving up the puck to the other team. And the people behind the delightfully nerdy named NHLNumbers.com are tracking this data on their own and coming to the obvious conclusion:

Carrying the puck in is way better than dumping it in, more than twice as good — and it’s not because of odd-man rushes or player skill or any other external factor; it’s just because having the puck in the opponent’s zone headed towards the goal is a lot better than trying to outrace the opponent to try to get the puck in the corner.

Most people don’t recognize just how big the difference is, and the data suggests that teams should be trying harder than they are to carry the puck in. If coaches are telling their third line to dump the puck, they are probably giving away scoring chances. If coaches are telling the players to dump the puck in borderline situations where they think carrying it might lead to a turnover, they are probably giving away scoring chances. ???? ????? Even regrouping and trying again might be better than dumping the puck in, especially when the team has their top line on the ice.

Of course this all needs to be taken with a grain of skepticism, as the dataset is very small and who knows what a larger amount of data will say about these preliminary conclusions. ??? ???? ?????
Opening Day 2012

No Comments

Today is Baseball’s North American Opening Day — A sure sign that the summer should be here soon enough and that ESPN will no longer commit 80% of their airtime to replays of dunks and half-court shots. (Don’t you sometimes wish that the “world-wide leader in sports” would cover some world-wide sports highlights. ??? ?????? I hear European Lawn Diving is in full swing right now.)

Baseball in Japan
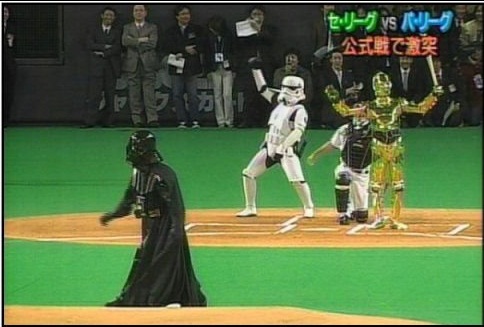
It was probably because it was 5am, but I'm pretty sure this is what I saw for MLB's opening series

At the beginning of any sporting event the only thing, really, for one to do, is to predict the outcome of that event. I am not doing anything different, but I shall mix it up by coming up with crazy ways to make these predictions. This year I am going to predict the final standings of MLB based solely on team salary. Using the salary numbers from Baseball Prospectus, I’ve calculated the teams Cost Per Win (CPW) for last year. And based on this years salary (and a 4% inflation due to an overall increase in spending across the league) and that CPW, here is what we have:

American League

AL East Wins Loss
 Tampa Bay Rays 123 39
 Boston Red Sox 89 73
 New York Yankees 89 73
 Toronto Blue Jays 88 74
 Baltimore Orioles 53 109
AL Central
 Detroit Tigers 109 53
 Kansas City Royals 106 56
 Cleveland Indians 81 81
 Chicago White Sox 55 107
 Minnesota Twins 50 112
AL West
 Texas Rangers 116 46
 Los Angeles Angels 85 77
 Seattle Mariners 51 111
 Oakland Athletics 41 121

National League

NL East Wins Loss
 Miami Marlins 115 47
 Philadelphia Phillies 98 64
 Washington Nationals 88 73
 Atlanta Braves 77 85
 New York Mets 45 117
NL Central
 Milwaukee Brewers 101 61
 St. Louis Cardinals 85 77
 Cincinnati Reds 76 86
 Pittsburgh Pirates 67 95
 Chicago Cubs 51 111
 Houston Astros 36 126
NL West
 Arizona Diamondbacks 115 47
 San Francisco Giants 84 78
 San Diego Padres 74 88
 Los Angeles Dodgers 62 99
 Colorado Rockies 61 101

As you can tell by the crazy number of Wins attributed to the Rays, that I do not take into account a variable CPW, where the higher the win total the more it costs for additional wins. But even without that, I wonder how close to this outcome, standings-wise, we will see? Will the Royals be a wildcard team? ???? ????? ?? ??????? How many teams will actually have 100+ wins (last year: 1)? 888 casino arab

Want to make your own predictions? Go ahead and leave a comment and we can come back here in a few months and see.

Science Picks Brackets, Part 2

2 Comments

This is a continuation from yesterday’s post.

The Second Round

In this round we have 4 different groups of games. Again I’ll start with the easier ones.

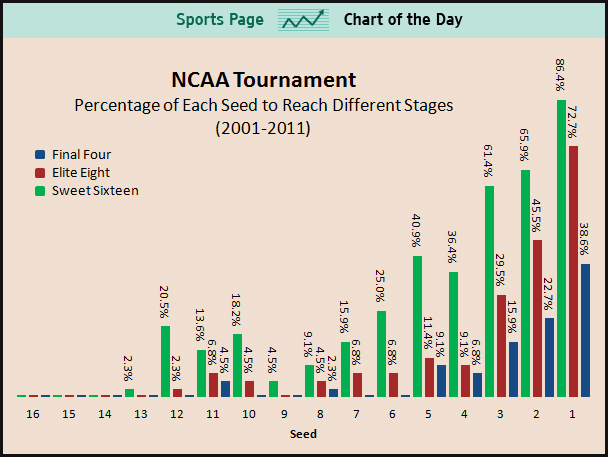
1/8/9/16 – The 1 seed wins here 87% of the time. A 16 seed has never actually made it to this game so the remaining 13% is split between the couple of times that an 8 or 9 pulled off the upset. Only way I’d pick an upset here is if I were in a big pool and wanted to go with a high risk strategy.

2/7/10/15 – While this isn’t as cut and dry as the 1 seed games, the 2 seed moves on 65% of the time. If you’re looking for a 2 seed to fall, look at experience. This year Missouri is a 2 seed but they got a pretty new coach and they could go against Florida with Billy Donovan who’s taken his squad to the Elite 8 4 times. ????? ???? Other than that, go with #2.

4/5/12/13 – If for some reason you have a 12v13 match here, pick the 12 seed as they have a 8-1 record but if you want to dig deeper, pick the team with more experience in the tournament. If you have a 12/13 going against a 4/5 It’s not as cut and dry as the seed value may imply as, historically, this upset is relatively common. The most likely match-up is, of course, the 4v5. History doesn’t tell you too much with 4’s having a slight edge winning 52% of the time. I’d look at points per game and Pythagorean expectation here… and that makes me look at maybe New Mexico over Louisville, but it would be hard to pick against Pitino and his experience.

3/6/11/14 – If it’s 3v11 or 6v14 you should probably go with the 3/6 as they have won 72% of these past match-ups. The 3v6 game is where you need to spend some time. If I had to pick an upset here, I’d go with Cincinnati. Maybe you want to go against the crowd? ?????? ??????? Pick UNLV to upset Baylor, hell, pick them to take down the Blue Devils. ??? ???? ??????? No one likes Duke so it’s a feel good pick and if it happens, no one else in your pool made that pick.

On to the Sweet 16!

1 Seed Bracket – on average, three out of 4 top seeds will make it past this round. Remember that when you decide you want to take down a 1 seed. Which one of the 4 looks ripe for the picking this year? Syracuse. They’d most likely take on a very good Wisconsin team and they are down one of their better players. Then again, you could play the odds and just advance the 1 seed if you wanted to be a bit more low risk. 2 Seed Bracket – In general the 2 seed wins here (70%) but if it’s 2v3 then it’s more reasonable (62%). If you’re looking for a team other than the 2 seed to come out of this bracket, I’d say maybe Baylor (or maybe even UNLV) over Duke or, for even more madness, pick Florida over Marquette – It could happen.

Success in NCAA by Seed Chart

Elite 8!

Look at the blue lines in the above chart. You should probably keep your Final Four selections to that realm of possibility. Look at what 1 seeds look weakest (Syracuse) or look at the better 2/3/4 seeds (Ohio State, Kansas, Baylor, Wisconsin) and make you selections from them.

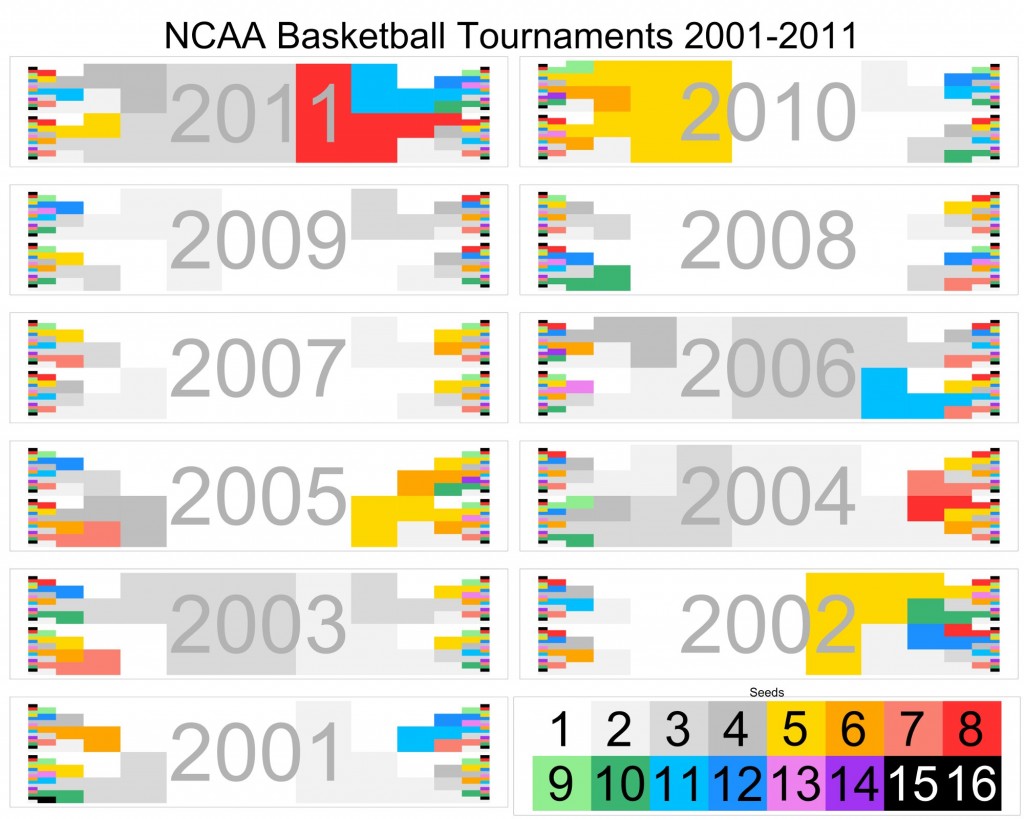
Chart: Cinderella Plot 2001-2011
The darker the color the larger the seed number. The lighter the graph the further the 1,2,3,4 seeds have gone.

Final Four!

Seeding can now be tossed out the window for the birds because that doesn’t matter anymore. Here’s where you pick the better teams for some other reason. Maybe you want to go by AP rankings? Kentucky (champion pick) over Missouri (because you have Missouri (3) over Michigan State (5) in the Elite 8) and Syracuse over North Carolina. Perhaps you want to go with Pythagorean expectation, that would be Kentucky (champion pick) over Michigan State and Ohio State over Kansas. Whatever you go with make sure that you have a road for a good…

Champion

Look at that chart above. 4 of the last 11 years it was a team that was not a 1 seed. Want to go back another 11 years? The 1 seeds won 68% of the time. That’s 2 out of every 3 years. So you want to win your pool? You should probably stick with a 1 seed. Perhaps go with North Carolina like President Obama:

I hope that this helps you, because it helped me make my decisions even though I went against the math a few times.

Bracketology: Science Picks Brackets

No Comments

There are hundreds of ways to go about picking your office pool brackets. You can go with your gut. You can go with the cooler mascot. You can go with whatever school has a higher seed and toss-ups based on a coin flip. Or you can be a giant nerd like myself and pour over a giant spreadsheet full of numbers trying to predict the future better than Miss Cleo. All of these strategies have merit and when it comes down to it, it’s still the future and we don’t know what will happen.

What I’m going to do today and tomorrow (in the morning so you can use this knowledge for yourself) is post my opinions and feelings and you can do with that what you will. (My suggestion would be to do the opposite of whatever I think.)

First a little primer from ESPN’s Numbers Never Lie for a quick rundown of making your picks with the help of numbers.

http://youtu.be/gBJNh1-MsTM

Round of 64ish:

Let’s start with the 1 seeds: The #1 seeds have lost the opening game 0% of the time So here’s an easy 4 points. Actually, I’ll go even further: Advance the 1 seeds to the Elite 8 (History shows that #1s make it this far 85% of the time). If you pick against a 1 seed here, you are probably giving away points. The tough call would be Syracuse with a missing Fab Melo, and a lower Pythagorean Expectation then Wisconsin.

Now the 2 v 15 games: A 15 has done the upset 4 times in the past 27 years, so I wouldn’t get your hopes up. There hasn’t been a 2 over 15 upset in 11 years now, so I guess we’re ripe for the picking. But even if the 15 did win, they never make the Sweet 16, so hedge your bets, and take the point (or loss of a point that no one else is gonna get anyway) and stick with the #2.

3 v 14: The #3 has won 85% of time in the past so now is the time to look into possible first round upsets, but looking at the field this year, I don’t see anything upsetting.

4v13: The lower seed wins 78% of the time here. So picking the right upset at this level might be nice. If I had to choose one, I’d take a look at New Mexico State over Indiana. Upset here would probably come from a high scoring team doing well, and NM St. are the highest of the 13 seeds with an average of 78.5 points per game.

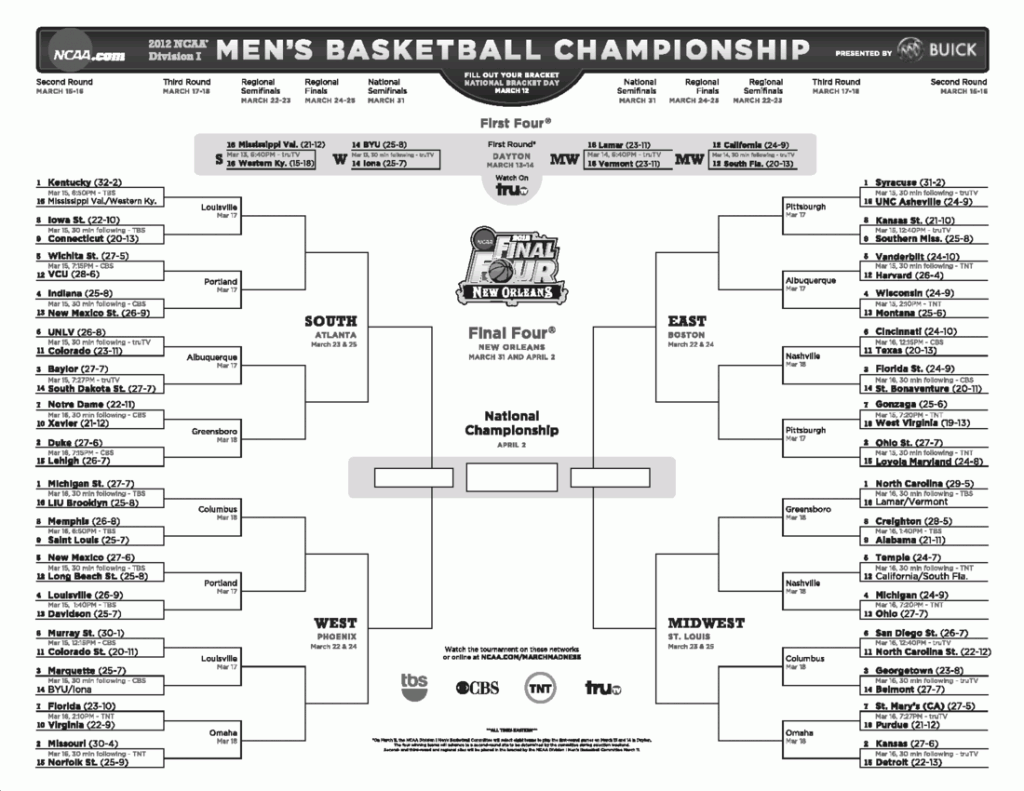
2012 NCAA Mens Bracket
Another suggestion is to print this out and then throw darts.

5v12: Time to stop giving the low seeds a free pass. Lower seeded teams only take 67% of these games historically. This year I’d think about upsets from VCU, who did well last year, or Cal (if they win tonight) based on their Pythagorean expectation.

6v11: Again 67% to the lower seeded team historically and that is against the trend of recent years. Possible upset here would be Texas over Cincinnati based again off Pythagorean  but also coaching experience.

7v10: 60% for the 7 seed. Possible upsets here would be Purdue over St. Mary’s or Virginia over Florida.

8v9: Pretty much 50-50 — Actually the 9 seed wins this 53% of the time. Since this is pretty much a toss-up anyway, go with your favorite method to pick these. Mine (as you may have noticed) is Pythagorean  expectation. With this the only “upset” (can a 9 over an 8 be an upset?) being Alabama over Creighton. Don’t worry too much about these games, because the winner is just going to lose to the 1 seed in the second round.

That should cover you for about 32 games. I hope to go over the remaining 32 games and to finish this all up tomorrow morning. Until Then you can check out this list of reasons to root for each team in the tourney. Also check out Wired for their method of going against the crowd to gain points that no one else in your pool will.

Geekapollooza AKA Sports Analytics Conf.

No Comments

This past weekend at MIT was what Mark Cuban calls “Geekapollooza,” but what everyone else calls the MIT Sloan Sports Analytics Conference.  It’s nice to see that the professional nerds on sports have their own conference. ???? ????? ?????  The description from their site states:

The conference goal is to provide a forum for industry professionals (executives and leading researchers) and students to discuss the increasing role of analytics in the sports industry. MIT Sloan is dedicated to fostering growth in this arena, and the conference enriches opportunities for learning about the sports business world. The conference is open to anyone interested in sports.

Though the real description is that a bunch of (usually highly educated) nerds come together with the people in sports management and discuss their idea and breakthroughs in statistics and analytics. The ESPN Numbers Never Lie team made a little video that explains the conference well:

As far as I can tell from what I saw/read/heard about coming out of SSAC these are the important stories:

  • Every sport was covered. Of course there were panels for baseball, basketball, soccer, hockey and football, but there were also panels discussing tennis equipment, like the new babolat pure strike Tennis Racquet as well as a tennis training aid.
  • Bill James is a god among nerds. He was a special guest on panels, podcasts, and ESPN interviews. I think everyone is trying to make up for the Baseball Abstracts days.
  • There was a panel dedicated to sports gambling, because it turns out that degenerates who gamble on sports have paved and are paving new roads in predictive sports analytics.
  • TicketMaster started talking about their new PriceMaster stab at dynamic ticket pricing. Probably means more expensive tickets, but maybe there’ll be a last-minute cheap-o (like myself) option.
  • EPSN was all over this thing: They has sponsorship ads in place. ??? ???? ???? ??? They had people on half the panels. ?????? ??? They had their own panels. They were even broadcasting live.

To end this, I’ll leave you with a video of Kevin McHale, who, though not as hating as Joe Morgan, has never been a fan of all the advanced statistical analysis until (as you’ll see at about 2/3s into the video the video) he realizes that his GM (Daryl Morey) is a big fan of this stuff. So much so that he’s a co-chair at Sloan.

Fill Those Seats

2 Comments

Serpico’s excellent post yesterday got me thinking.

A professional baseball franchise has two goals which sometimes conflict: winning as many games as possible and drawing in fans. You might think those two go hand in hand but, as Serp pointed out, swapping out new talent every season makes it hard for the fans to invest in the team.

“Well, yes,” I thought, “but you get to save so much money. ???? ???? ????? ??? ????

Then I started to wonder – how much money? And what’s the tradeoff?

So I went to ESPN.com and Sportsline.com and I got two figures:

  • Total player salaries by team;
  • Average home game attendance as a percentage of stadium capacity

And I made a graph in Excel.

Seats vs Salary

(click the graph to expand to its full size)

Some interesting findings:

  • In the lower half, you get two sudden spikes at the San Diego Padres and the Milwaukee Brewers. They get White Sox level attendance despite playing like, well, the Padres and the Brewers. Where’s the draw? What did the Brewers do last season that I and the rest of the world missed?
  • The Boston Red Sox had 101.4% attendance on average in 2006. That’s not seats sold; that’s actual home game attendance. Look it up yourself. It pleases me to know that John Henry will admit more fans than the stadium has seats; anything for revenue.
  • The trendline continues upward pretty clearly except for one embarassing drop by the Baltimore Orioles. ???? ???? ??? They spent $93.55 million in 2006 on player salaries but only filled 57.1% of their seats on average. They’re spending St. Louis Cardinals money to get Toronto Blue Jays attendance.

I don’t know whether this data supports my thesis or Serpico’s. It may be too soon to draw that kind of conclusion. But I do know that it’s really interesting. ????? ??? ????

Moneyball: Con

3 Comments

Today’s post is Part Two of Two, the “Con” argument in an ongoing and mostly friendly NerdsOnSports debate over “Moneyball,” the stats-driven baseball management popularized by Oakland A’s General Manager Billy Beane.

My esteemed friend and fellow Nerds on Sports contributor Perich laid out a series of perfectly reasonable, incontestable facts (the rules of baseball – a team needs to score more runs, each team has 27 outs to do it, fixed number of players to acquire, etc) to begin his conversation.  He then, keeping those facts in mind, laid out the crux of Moneyball: certain statistics mean more than others and by finding and properly weighting those statistics, a GM can better evaluate potential than his competitors.  It all makes a lot of sense, given the nature of the game and how the machinations of baseball scouting work. ??? ?????? ??? ????????

My issue is not with any of these facts or assertions surrounding Moneyball, per se, but rather with the strategic implementation of the science.  Allow me to explain.  Paying for undervalued or overlooked talent is fantastic, as is paying for any undervalued commodity in the marketplace.  In 2006, Beane compiled the 5th best record in baseball with the 21st highest salary.  Seems like a series of sound investments.  Expanding it back to prior seasons –  in 2005, Beane got the 10th best record with the 21st highest and in 2004, it was the 9th best with the 16th.  Solid year in and year out.  The A’s, with this strategy have produced far more than their salary level would suggest. ????? ???? ??? ????    Seems like Moneyball is working.

But I’d like to reveal another set of numbers – 26th,  19th, 19th.  That’s where the A’s finished in game attendance in 2006, 2005 and 2004.  Of note, they’re on pace for 26th place again this year.  That’s a downward trend in the number of folks that are interested enough in the A’s to go shell out money to watch them play.  In that, I believe, lies one of the hidden costs of Moneyball.  It is tough for a fanbase to get behind a team which such a revolving door concept of talent.  Miguel Tejada left town before the 2004 season, Jermaine Dye before 2005 and Zito and Frank Thomas before 2007.  The A’s, in keeping with their spending and scouting strategy, got what they could out of these players while they were still reasonably priced and were forced to jettison them after the market got smart.  It’s part of the game that Beane has to play with his budgetary constraints.  It’s chicken-and-egg scenario though.  Beane doesn’t have the money to keep/retain big name talent, and fans get disgusted and don’t attend games with regularity, and empty seats prevent Beane from getting the money to keep/retain big name talent.  Sure, you might be able to get more VORP per Dollar with Nick Swisher than Jermaine Dye, but is that what the ticket-buying, jersey-wearing fans care about?  Or do they care about having a masher they’ve heard of drilling them into the seats at McAfee?

Baseball pundits and average fans alike don’t generally believe the A’s are going to ever mount a big-time run deep into the playoffs.  Certainly not this year (they’re sub-.500) and most likely not next year.  And if they have, they’ve been quiet about it.  The A’s, using their strategy, can be a middling team at the price of a basement team.  From a financial perspective, it’s wonderful because they always beat expectations.  But from a baseball perspective, there’s just no fire there.  The object of a baseball game is to score more runs than the opposing team.  But the object of a baseball season is to win a championship. ????? ???? ???? ?????   Moneyball can help the A’s accomplish the first against teams with a mightier payroll.  But until I see them in a World Series Game, I’ll be skeptical of the second.  Haven’t St. Louis and Arizona been getting there on the cheap lately?  I wonder what their GMs are using.

Moneyball: Pro

No Comments

Today’s post is Part One of Two, the “Pro” argument in a NerdsOnSports exclusive debate over “Moneyball” – or stats-driven baseball management. ???? ???? ??? Serpico takes the opposing side elsewhere.

My argument is that a manager can derive superior value in his team by managing based on statistics, rather than what are commonly called “intangibles.”

Consider the following:

(1) The object of a baseball game is to score more runs than the opposing team.

(2) Baseball does not have a clock; it ends when each team suffers 27 outs.

(3) Given 1 and 2, the team that can score more runs while suffering fewer outs will win a ballgame.

(4) Players earn runs by advancing along the basepaths. This can be done either by hitting or by being advanced through a walk or pitcher error (balk, etc).

(5) There is a fixed pool of available players for any given season. There are a fixed number of positions in the starting lineup – nine, to be precise.

As Kevin Bacon said in A Few Good Men, these are the facts of the case, and they are not in dispute. Those are the rules of baseball. All of the above are objectively true.

From that, I will assert the following:

(6) Given #4, a statistic which measures all the ways that a player can advance along the bases (for instance, on-base percentage) will be a more useful tool in evaluating a player than a statistic which does not (for instance, batting average).

That right there is the core of Moneyball – the idea that many traditional statistics, such as stolen bases, RBIs and batting average are not as useful as OBP, slugging or VORP.

Consider: RBI is the number of runs a player bats in. But in order to hit in a run, another player needs to have advanced to scoring position. So your RBI stat hinges on the scoring ability of the player before you in the lineup. This changes every time the lineup is altered, or every time you change teams, but no one thinks to qualify RBI with a little asterisk.

Batting average is neat, too, but it doesn’t measure the times that a player will advance a base through being walked. ???? ????? ??? ???? ??????? And for the big hitters like David Ortiz, Rickey Henderson or Joe Morgan, bases on balls constitute a significant percentage of their run production.

(7) Given #5, teams with less money to spend will not be able to outbid teams with more money. As such, the only way to maintain a competitive edge over those teams is to find undervalued statistics – stats which point the way to potential runs without seeming to.

The Oakland A’s do not have as much money to throw around as the New York Yankees (the most lucrative sports franchise in the world after Arsenal Football). Oakland will never beat New York in a bidding war over a hot free agent. What they can do, however, is search for run-generating players who New York overlooks. They do this by mining statistics that no one else looks at (such as OBP, or pitches broken down by ballpark) and turning up players like Scott Hatteberg and Kevin Youkilis.

That, right there, is the core of the Moneyball contention. There are certain statistics which illuminate a player’s potential more than others. If those statistics remain overlooked, a money-savvy manager can scoop up big-hitting talent at bargain prices. Such a case seems indisputable. ????? ??? ???? ???????

Now that you’ve read my argument, go read Serpico’s counter.