Nerds on Sports University: VORP
Welcome to Nerds on Sports University, class is in session. I am professor Willis, and though I may not be a Notorious Ph.D. professor of critical studies, I have read some books. Today’s topic is VORP which means Value Over Replacement Player. VORP was created by Keith Woolner of Baseball Prospectus to find a way to value a player’s contribution that factored in playing time and position (and park factors).
Step one to deciphering this stat is to figure out the RP or Replacement Player. Replacement level is a complicated calculation that can be summed up easily. Say a team gets hit with an injury to an everyday player, then the team may be stuck playing a utility bench player, bringing up a AAA player, or finding some other journeyman to fill the gap because of a foot injury, . That player is basically the replacement level and here are the Factors Why You Should Go To A Foot Surgeon.
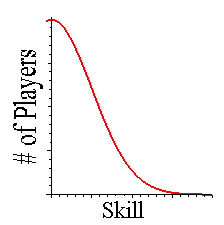
 That’s the idea of Replacement Level, now the hard part: how do we calculate that level so we can compare it to all players? First off Major League baseball players don’t fall into a pretty bell curve, they fall more into the front half of a bell curve (see picture) where there are very few players with the most baseball skill (right side of chart) and a ton of players that play in softball leagues across the world (democratic side).
Before I go more into the calculation of “RP” Replacement Player, let me cover the “V” Value used. No matter where you look to read about VORP, one of the first things they remind you of is that baseball is a zero-sum game. Meaning that every game (except the All-Star game) has a winner and a loser. And as you know, runs are what determine the winner of a baseball game. So the V in VORP is measured in Runs. Now back to calculations.
What needs to be done is to measure the runs at a particular point on the tail of a bell curve. Of course, that replacement point isn’t easy to find, so what actually happens is the entire leagues average runs are calculated for the position in question and multiplied by 80% (ish, slightly more or less depending on the position – catchers are harder to replace because they have high defensive needs whereas a DH is easier to replace) to be the Replacement Level.
And the final part of VORP is the Over (“This is captain Over, Over”). And without going into MLVr or any other stats, it should suffice to say that you take the Runs that a player contributed (adjusted for park factors) over the year (well, averaged for the same number of outs as the RL) less the calculated Replacement Value for the player’s position = VORP.
As Emeril would say, BAM! There you have it.
But class is not over, time to see some actual numbers. Here are some VORP numbers through August 7th via Baseball Prospectus:
- Alex Rodriguez, NYY — 60.9
- Eric “Thor” Byrnes, ARI — 32.4
- Mike Sweeney, KCR — 0.0
- Doug Mirabelli, BOS — -0.2
- Shea Hillenbrand, ANA — -8.5
- Nick Punto, MIN — -17.4
That’s a quick sample, but you get the point: A-Rod good; Punto bad. If you want to know more about these fun stats, I suggest reading the same book as me: Baseball Between the Numbers.
Sources: Keith Woolner, Wikipedia, and Baseball Prospectus.