Tag: statistics

Nerds on Sports University: LUCK

No Comments

In the last Nerds on Sports University, I gave you a very technical and involved statistic. This time, I’m going for something a little more light hearted. Today, I will tell you about the pitching stat LUCK. LUCK isn’t an acronym for anything it’s just luck.

Before I get into LUCK itself, let’s look at pitchers Expected Win-Loss [E(W) & E(L)]. We all know that Wins and Losses are very dependent on how the rest of the pitchers team and your bullpen, especially if you’ve been watching Bronson Arroyo this year (Luck -6.31). To calculate E(W) and E(L) we look at the pitchers innings pitched and runs allowed for each game and compare that to the same pitching line’s wins and losses historically. So if a pitcher went 6 innings and gave up 5 runs you would expect them to get a win 30% of the time. So the E(W) is .3 and the E(L) is .7.

To get LUCK we compare the expected numbers to the actual numbers. Taking the difference between the expected numbers and the actual numbers and adding that together (W-E(W)) + (E(L)-L) is LUCK. So a pitcher with a high LUCK is lucky and their team is helping them out. I hope you enjoy LUCK, and I will end this class with some current LUCK stats. Read More
Nerds on Sports University: VORP

3 Comments

Welcome to Nerds on Sports University, class is in session. I am professor Willis, and though I may not be a Notorious Ph.D. professor of critical studies, I have read some books. Today’s topic is VORP which means Value Over Replacement Player. VORP was created by Keith Woolner of Baseball Prospectus to find a way to value a player’s contribution that factored in playing time and position (and park factors).

Step one to deciphering this stat is to figure out the RP or Replacement Player. Replacement level is a complicated calculation that can be summed up easily. Say a team gets hit with an injury to an everyday player, then the team may be stuck playing a utility bench player, bringing up a AAA player, or finding some other journeyman to fill the gap because of a foot injury, . That player is basically the replacement level and here are the Factors Why You Should Go To A Foot Surgeon.

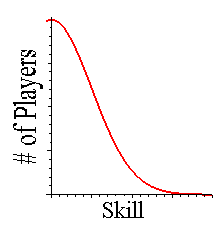
Baseball Bell CurveThat’s the idea of Replacement Level, now the hard part: how do we calculate that level so we can compare it to all players? First off Major League baseball players don’t fall into a pretty bell curve, they fall more into the front half of a bell curve (see picture) where there are very few players with the most baseball skill (right side of chart) and a ton of players that play in softball leagues across the world (democratic side).

Before I go more into the calculation of “RP” Replacement Player, let me cover the “V” Value used. No matter where you look to read about VORP, one of the first things they remind you of is that baseball is a zero-sum game. Meaning that every game (except the All-Star game) has a winner and a loser. And as you know, runs are what determine the winner of a baseball game. So the V in VORP is measured in Runs. Now back to calculations. Read More

And five points for sticking the landing

4 Comments

Megalomaniac Scott Boras is pushing for a new baseball stat to recognize strong defensive skills. Now while defensive skills do tend to be overlooked in judging baseball players’ worth, the attempt to quantify them through such an ill-defined metric as “exceptional play” does not really indicate anything beyond a player’s ability to show up on Baseball Tonight’s Web Gems.

The official scorer would be asked to distinguish between an exceptional play and a routine one in the same way he is asked to distinguish between a hit and error.

Now, the distinction between a hit and an error is usually clear-cut. The fielder misjudged, dropped, or bobbled the ball. ???? ?????? Difficult to mistake one for the other. ????? ?????? ??? ???? But what makes a fielding play “exceptional”? Distance? Style? Degree of difficulty? Should we have fielding judges giving out scores like in diving? ???? ???? ??????? If player A makes a diving catch, but player B is fast enough to already be in position to make an “ordinary” catch, don’t they deserve the same amount of praise?

Other comically stupid ideas mentioned were the nine-game world series with the first two at neutral sites. I don’t see how this would make anybody happy, and I have no idea why anyone would want to do this. Scott Boras needs to stick with inflating contracts and stay away from how the game is actually played.

Crunching The Numbers

3 Comments

One of my favorite non-sports blogs, CoyoteBlog, linked me to this little gem the other day: a breakdown of expected runs given runners on base and outs already scored.

RE 99-02 0 1 2
Empty 0.555 0.297 0.117
1st 0.953 0.573 0.251
2nd 1.189 0.725 0.344
3rd 1.482 0.983 0.387
1st_2nd 1.573 0.971 0.466
1st_3rd 1.904 1.243 0.538
2nd_3rd 2.052 1.467 0.634
Loaded 2.417 1.65 0.815

So, for instance, if you have a runner on third and 1 out, you can expect 0.983 runs in this inning. Runner on 1st and 2 outs, you only have a 25.1% chance of scoring.This kind of data can occupy me for hours. It looks relatively unimpressive – such a small table! – but there’s so much implied in those numbers.

calculate THIS!There’s a line in The Hunt for Red October where the Russian sub’s navigator boasts about being able to “fly a plane in the Alps with no windows” with a compass and a map. Well, I could manage a professional baseball team in an underground bunker with no windows given a spreadsheet with the team’s stats, and this table.

Here’s an example, taken from the Coyote himself:

You can actually calculate what percentage chance of success you need to justify stealing second. Lets again take man on first, no outs. The RE is 0.953. If he steals successfully, the RE goes to 1.189. If he gets thrown out, the RE goes to 0.297 (bases empty, one out). If X is the probability of stealing success, then 1.189X+0.297(1-X)>0.953. X must be about 74% or greater.

I open it up to the forum. What other exciting facts or predictions does this matrix make for you?

Everybody’s Got Something To Hide Except Me and Joe Morgan

9 Comments

There’s already a site doing it better, but I’d like to weigh in on something terribly stupid Joe Morgan said during last Sunday’s Red Sox / Yankees game.

He said, and I paraphrase, “guys like Ted Williams didn’t get to be hitting champions by getting walked a lot. People talk all the time about drawing walks, but Ted Williams didn’t get a lot of walks.”

Ted Williams, USMCEven without access to a laptop, the Internet and a century of baseball statistics at the time, I knew in my heart that that was false. First, because Joe Morgan was saying it with authority. And second, because, well, when you’re pitching to a guy who hits .318 on a bad season, you’ll occasionally throw a few outside.

However, I’d be no better than Stumbling Joe himself if I didn’t find the facts to back me up. So here, in an easy to read chart, are the all-time career walk leaders:

Rank Player Years AB BB
1. Barry Bonds 21 9507 2426
2. Rickey Henderson 25 10961  2190
3. Babe Ruth 22 8399 2062
4. Ted Williams 19 7706 2019
5. Joe Morgan 22 9277 1865
6. Carl Yastrzemski 23 11988 1845
etc.

(Edited to clean up HTML and revise figures that suggested Rickey Henderson was one of the “giants in the earth […] mighty men which were of old, men of renown” (Genesis 6:4))

It’s no longer shocking that Joe Morgan has such little respect for statistical analysis that he’d be flat-out, incontrovertibly wrong about whether Teddy Ballgame drew a lot of walks or just a few. That’s par for the course. The man wouldn’t be doing his job if he were right more than half the time.

But you’d think that, given the fact that Ted William’s #4 and Joe Morgan himself is #5, that he’d at least remember that number. That he might have heard his own name brought up in that context before. That Joe Morgan might at least be cognizant of a record he’s really really close to Ted Williams on.

Ted Williams drew 154 more walks than Joe Morgan did, over 1571 fewer at-bats. That tells me that, yeah, better hitters draw more walks, regardless of how counter-intuitive that might strike the dumbest man to talk about baseball since Tim McCarver. It also tells me that Joe Morgan not only knows nothing about statistics – he knows nothing about his own career.

Revising the Passer Rating

6 Comments

This post may contain recycled content.

I have a mission for you: revise the QB rating.

The QB rating (technically called the “passer rating,” as that’s all it’s meant to evaluate) is an arcane formula devised when the NFL and the AFL merged in order to standardize statistics. Rather than compare quarterbacks to each other – which provided no metric for season-to-season growth, statistician Don Smith devised a way to measure their progress objectively.

The problem is that (A) it’s not very objective and (B) it’s cryptic.

(A) The rating system is great, in theory. Take the four key areas of a passer’s performance: completion percentage, yards gained per pass, number of touchdowns and number of interceptions. ???? ????? ?? ???????? Normalize them against some industry-standard benchmarks (50% pass completion, 55 interceptions per 1000 passes, etc). Total these numbers and voila.

Peyton Manning wishes he had the talent of Drew BreesThe problem is, those benchmarks were set in 1971 and have not been revised since. The “yards per pass” metric, which figures an average of 7, punishes QBs whose coaches use the fire-and-forget “West Coast Offense.” Is a 5.5% interception percentage still average? Look at the numbers yourself and tell me: as of the end of the 2006 season, Dallas’s Tony Romo and the Saints’ Drew Brees led the league in passer rating (89.6, 88.3, respectively), while those jackasses Tom brady and Peyton Manning couldn’t even crack the top 5.

(Cold Hard Football Facts agrees with me, and has some pictures of Pamela Anderson to boot. No, for serious)

(B) In order to normalize against those aforementioned benchmarks, you have to go through some weird hoops. Nothing terribly complicated – just lots of division.

({[(Comp / Att) x 100 – 30]/20 + [(Yards / Att) – 3 x 0.25] + [(TD / Att) x20] + [2.375 – (INT / Att) x 25]} / 6) x 100

Remember your order of operations and show all work.

There has to be a better way – and this wouldn’t be “Harebrained Schemes Tuesday” if I didn’t come up with one.
Read More

On-Base Percentage / “The Bubble”

1 Comment

Two crucial posts from elsewhere in Internovia:

1. From Fire Joe Morgan, the blog that wants ESPN to fire, well, inept baseball commentator Joe Morgan:

[sez Morgan] “but that’s how people compare statistics. My point is you can’t compare things with statistics.”

Think about that, people. “You can’t compare things with statistics. ?????? ???????

Exactly what, one might be tempted to ask, as one’s hands were shaking so badly one would think one had just survived an assassination attempt, might one use to compare things? Metaphor? How about the infallible human memory? ???? ????? Or perhaps poesy?

Much have I traveled, in realms of gold
And many goodly states and kingdoms seen
Round many Western Islands have I been,
And I have observed some stuff about some shortstops
Bill Hall did not have a monster year
Derek Jeter has a calmer set of eyes
David Eckstein is super clutch
Please don’t show me statistics that disprove my observations

2. Via Mahalanobis (which I typically don’t even read for sports), the following:

Watching the NFL (ie, real football for non-Americans) draft last weekend, they would often mention some prospect “has a good bubble”. I didn’t know exactly what they were talking about, but got confirmation on the radio today. ???? ??? ???? It means they have a good–big–butt. As the gluteus maximus, or buttock muscle, is the largest muscle in the human body, it is useful signal of overall musculature.